
Get your exact price
Three quick steps. A real quote for your real bathroom.

Verify us in one tap. We are accredited by the Better Business Bureau. Your quote is written, free and comes with zero obligation.
Florida's older population, county by county
Where Florida's 4.6 million residents aged 65 and older live, which counties are oldest, and what that means for families planning a safer home.
Direct answer: 21.1% of Florida residents are 65 or older, versus 16.8% nationally, the second-highest share of any state after Maine. Sumter County, home to most of The Villages, is the oldest at 57.8%, followed by Charlotte (40.4%) and Sarasota (37.3%). Source: Census ACS 2019–2023.
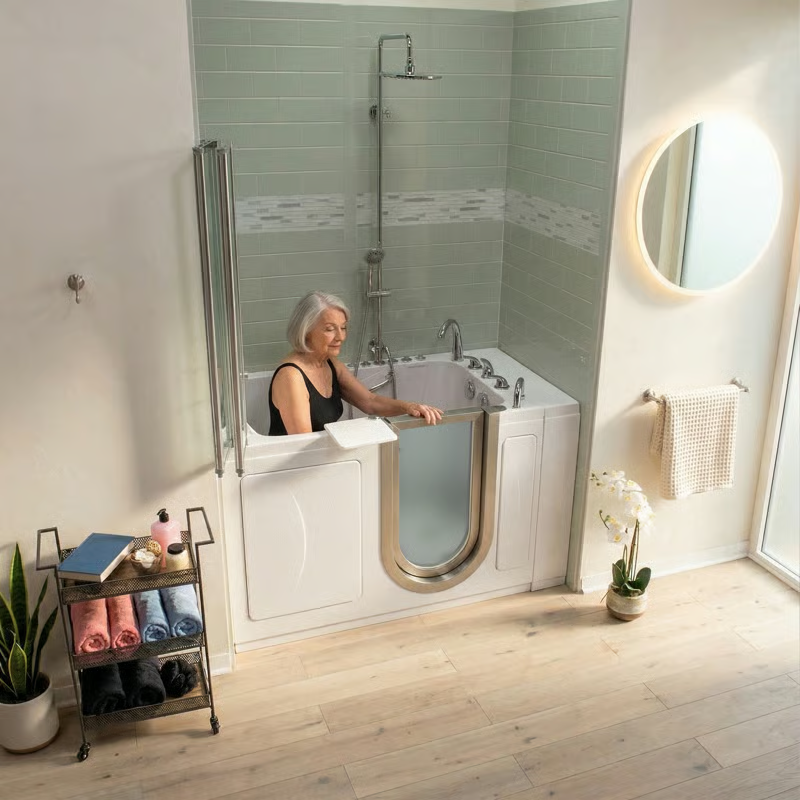 Census data for Florida families
Florida is older than almost every state
Using the Census Bureau's American Community Survey, 21.1% of Floridians are 65 or older, compared with 16.8% of the whole country. Only Maine, at 21.9%, has a higher share. In raw numbers, Florida's 4,630,733 residents aged 65 and up are second only to California's 5,994,486.
of Floridians are 65 or older. The U.S. figure is 16.8%.
Floridians are 85 or older, the age group with the highest rate of bathroom injuries in CDC research.
of Floridians 65 and older living in the community report at least one disability.
All figures: U.S. Census Bureau, American Community Survey 2019–2023 5-year estimates, tables B01001 (age) and B18101 (disability). Five-year estimates describe the period as a whole, not a single year, so they run a little behind the Census Bureau's newest single-year population estimates.
The 15 Florida counties with the oldest populations
Florida's older residents are not spread evenly. The highest shares cluster around The Villages, along the Gulf coast from Citrus County to Collier County, and on the Treasure Coast. In Sumter County, home to most of The Villages, 57.8% of residents are 65 or older. Among the roughly 3,200 counties in the United States, only two tiny Texas counties with fewer than 100 residents each report a higher share.
Share is one story. Headcount is another.
The big South Florida counties have younger populations on average, but they are home to the largest number of older adults simply because so many people live there. Miami-Dade County alone has more residents 65 and older (452,114) than 54 of Florida's 67 counties have residents of any age.
That matters when you plan help. In a county with a high share, services for older adults are part of daily life, and many neighbors have already made the same changes to their homes. In a large county with a lower share, there are more providers, but waiting lists for programs can be longer because more people are asking.
| County | Age 65+ | Share |
|---|---|---|
| Miami-Dade | 452,114 | 16.8% |
| Palm Beach | 370,797 | 24.6% |
| Broward | 342,594 | 17.6% |
| Pinellas | 248,460 | 25.9% |
| Lee | 229,480 | 28.9% |
Source: ACS 2019–2023 5-year estimates, table B01001.
What these numbers mean at home
Age alone does not decide who needs a safer bathroom. Health, balance, medicines and the house itself matter more. But two numbers point at the size of the need in Florida.
First, 9.4% of Floridians are 75 or older, compared with 6.8% nationally. Second, 31.4% of Floridians 65 and older who live in the community, not in nursing homes, report at least one disability, which the survey defines to include trouble walking or climbing stairs, trouble bathing or dressing, and hearing, vision or memory difficulties. For many of them, the highest step in the house is the side of the bathtub.
The CDC found that more than a third of nonfatal bathroom injuries treated in emergency rooms happened while bathing, showering or getting out of the tub or shower, and that injury rates rose with age. Our bathroom fall prevention guide covers the fixes that matter most.
Looking for help in your county? Every Florida county is served by one of 11 Area Agencies on Aging. Our county-by-county list shows which one is yours, or call the Elder Helpline at 1-800-963-5337.
City guides for the oldest regions
- The Villages: Sumter, Lake and Marion counties
- Sarasota, Venice and Bradenton
- Naples and Collier County
- Fort Myers and Cape Coral
- Tampa Bay, including Pinellas
- Palm Beach County
Florida's population aged 65 and older, county by county
Tap a column heading to sort. On a phone, swipe the table sideways to see every column. The disability column covers people 65 and older who do not live in institutions such as nursing homes, so its base is slightly smaller than the age columns.
| Alachua | 14.9% | 42,114 | 5.9% | 32.2% | 281,751 |
|---|---|---|---|---|---|
| Baker | 15.1% | 4,253 | 5.9% | 48.4% | 28,186 |
| Bay | 18.2% | 33,065 | 7.1% | 37.3% | 181,368 |
| Bradford | 18.1% | 5,055 | 7.7% | 27.6% | 27,888 |
| Brevard | 24.2% | 150,162 | 10.6% | 32.5% | 620,533 |
| Broward | 17.6% | 342,594 | 7.6% | 31.6% | 1,946,127 |
| Calhoun | 17.9% | 2,428 | 8.4% | 49% | 13,593 |
| Charlotte | 40.4% | 78,873 | 18.8% | 31.5% | 195,083 |
| Citrus | 36.3% | 57,659 | 16.6% | 32.1% | 158,693 |
| Clay | 16.8% | 37,541 | 6.4% | 33.1% | 223,436 |
| Collier | 33.6% | 130,092 | 17.4% | 22.1% | 387,681 |
| Columbia | 20% | 14,143 | 8% | 42.6% | 70,755 |
| DeSoto | 23.8% | 8,254 | 10.7% | 37.8% | 34,719 |
| Dixie | 23.6% | 4,007 | 9.6% | 48.4% | 16,952 |
| Duval | 15% | 150,870 | 5.8% | 33.7% | 1,007,189 |
| Escambia | 17.7% | 57,060 | 7.1% | 39.2% | 323,275 |
| Flagler | 31.1% | 37,833 | 13.1% | 28.4% | 121,710 |
| Franklin | 26.2% | 3,257 | 10.3% | 39% | 12,418 |
| Gadsden | 19.4% | 8,485 | 7.3% | 39.4% | 43,642 |
| Gilchrist | 20.2% | 3,737 | 8.4% | 47.5% | 18,494 |
| Glades | 26.6% | 3,273 | 13.9% | 34.1% | 12,324 |
| Gulf | 23.5% | 3,469 | 8.5% | 33% | 14,772 |
| Hamilton | 19.6% | 2,634 | 7.5% | 40.3% | 13,445 |
| Hardee | 16.3% | 4,157 | 7% | 37.8% | 25,508 |
| Hendry | 13.6% | 5,540 | 5.8% | 36.1% | 40,798 |
| Hernando | 26.6% | 53,527 | 12% | 35.6% | 201,512 |
| Highlands | 35.9% | 37,300 | 18.7% | 36.1% | 103,808 |
| Hillsborough | 14.8% | 221,121 | 5.9% | 34.8% | 1,489,634 |
| Holmes | 20.2% | 3,966 | 8.6% | 42% | 19,626 |
| Indian River | 34.2% | 56,023 | 16.2% | 29.3% | 163,856 |
| Jackson | 20.9% | 9,961 | 9.2% | 38.8% | 47,652 |
| Jefferson | 24.5% | 3,605 | 9.9% | 43.9% | 14,713 |
| Lafayette | 20.1% | 1,612 | 8% | 35.4% | 8,035 |
| Lake | 26.6% | 106,155 | 12.3% | 31.8% | 398,696 |
| Lee | 28.9% | 229,480 | 13.6% | 27.1% | 792,692 |
| Leon | 14.4% | 42,546 | 5.5% | 30.9% | 295,335 |
| Levy | 25% | 11,059 | 10.5% | 39.2% | 44,276 |
| Liberty | 13.8% | 1,053 | 5.9% | 53.8% | 7,650 |
| Madison | 22.6% | 4,096 | 8.7% | 37.2% | 18,113 |
| Manatee | 28.2% | 117,425 | 13% | 29.1% | 416,020 |
| Marion | 28.7% | 111,456 | 13.3% | 31.1% | 387,697 |
| Martin | 31.8% | 50,992 | 16% | 28.4% | 160,464 |
| Miami-Dade | 16.8% | 452,114 | 7.6% | 32% | 2,685,296 |
| Monroe | 24.3% | 19,888 | 9.8% | 25.7% | 81,840 |
| Nassau | 23.3% | 22,097 | 9.2% | 32.7% | 94,653 |
| Okaloosa | 16.4% | 35,106 | 6.5% | 36% | 214,281 |
| Okeechobee | 20.1% | 8,072 | 9.5% | 41.6% | 40,249 |
| Orange | 12.8% | 183,681 | 5% | 33.6% | 1,440,471 |
| Osceola | 13.4% | 54,492 | 5.3% | 37.9% | 406,943 |
| Palm Beach | 24.6% | 370,797 | 12.5% | 28.8% | 1,507,453 |
| Pasco | 22% | 129,661 | 9.9% | 34.7% | 588,758 |
| Pinellas | 25.9% | 248,460 | 11.8% | 31.2% | 960,565 |
| Polk | 19.7% | 149,631 | 8.7% | 31.5% | 760,961 |
| Putnam | 23.5% | 17,472 | 9.3% | 36.3% | 74,235 |
| Santa Rosa | 16.5% | 31,890 | 6.1% | 35.2% | 193,719 |
| Sarasota | 37.3% | 167,531 | 18.6% | 27.1% | 449,011 |
| Seminole | 16.3% | 77,479 | 6.7% | 30.1% | 474,912 |
| St. Johns | 20.9% | 60,957 | 8.4% | 25.3% | 292,243 |
| St. Lucie | 24.5% | 84,733 | 10.9% | 33.1% | 346,237 |
| Sumter | 57.8% | 79,463 | 27% | 22.8% | 137,536 |
| Suwannee | 21.1% | 9,368 | 8.7% | 34.8% | 44,484 |
| Taylor | 20.9% | 4,467 | 8.8% | 36.3% | 21,422 |
| Union | 17.2% | 2,674 | 6.9% | 45.9% | 15,551 |
| Volusia | 25.1% | 142,584 | 10.8% | 34.3% | 568,229 |
| Wakulla | 16.6% | 5,750 | 5.9% | 35.7% | 34,608 |
| Walton | 19.8% | 15,801 | 7.3% | 32.7% | 79,846 |
| Washington | 18.3% | 4,633 | 7.6% | 44.9% | 25,259 |
| Florida | 21.1% | 4,630,733 | 9.4% | 31.4% | 21,928,881 |
| United States | 16.8% | 55,970,047 | 6.8% | 32.9% | 332,387,540 |
Source: U.S. Census Bureau, American Community Survey 2019–2023 5-year estimates (tables B01001 and B18101). Small counties have wider margins of error. "Share 75+" is the share of all residents who are 75 or older.
Florida metro areas ranked by their 65+ share
Metro areas group a central city with the counties around it, which is closer to how families think about "the area" they live in. The median age column shows the midpoint: half of residents are older, half are younger.
| Metro area | Share 65+ | Median age | Age 65+ | Total population |
|---|---|---|---|---|
| Wildwood-The Villages | 57.8% | 68.4 | 79,463 | 137,536 |
| Punta Gorda | 40.4% | 60 | 78,873 | 195,083 |
| Homosassa Springs | 36.3% | 56.9 | 57,659 | 158,693 |
| Sebring | 35.9% | 54.2 | 37,300 | 103,808 |
| Sebastian-Vero Beach-West Vero Corridor | 34.2% | 55 | 56,023 | 163,856 |
| Naples-Marco Island | 33.6% | 53.1 | 130,092 | 387,681 |
| North Port-Bradenton-Sarasota | 32.9% | 53.6 | 284,956 | 865,031 |
| Cape Coral-Fort Myers | 28.9% | 49.3 | 229,480 | 792,692 |
| Ocala | 28.7% | 48.2 | 111,456 | 387,697 |
| Port St. Lucie | 26.8% | 47.7 | 135,725 | 506,701 |
| Deltona-Daytona Beach-Ormond Beach | 26.1% | 47.8 | 180,417 | 689,939 |
| Palm Bay-Melbourne-Titusville | 24.2% | 46.8 | 150,162 | 620,533 |
| Tampa-St. Petersburg-Clearwater | 20.1% | 42.2 | 652,769 | 3,240,469 |
| Lakeland-Winter Haven | 19.7% | 39.6 | 149,631 | 760,961 |
| Miami-Fort Lauderdale-West Palm Beach | 19% | 41.9 | 1,165,505 | 6,138,876 |
| Panama City-Panama City Beach | 18.2% | 41.4 | 37,698 | 206,627 |
| Crestview-Fort Walton Beach-Destin | 17.3% | 39.2 | 50,907 | 294,127 |
| Pensacola-Ferry Pass-Brent | 17.2% | 38.9 | 88,950 | 516,994 |
| Jacksonville | 16.8% | 39.1 | 275,718 | 1,645,707 |
| Gainesville | 16.5% | 34.3 | 56,910 | 344,521 |
| Tallahassee | 15.6% | 34.7 | 60,386 | 388,298 |
| Orlando-Kissimmee-Sanford | 15.5% | 38.3 | 421,807 | 2,721,022 |
Source: U.S. Census Bureau, American Community Survey 2019–2023 5-year estimates (tables B01001 and B01002). Micropolitan areas are left out.
Method and limits
The 65 and older counts add up the twelve age groups from 65 to 85 and over, for men and women, in Census table B01001. The 75 and older counts use the six groups from 75 up. Disability shares come from table B18101 and divide people 65 and older with any disability by all people 65 and older in that table.
These are survey estimates, not a full count, and each carries a margin of error. They also average five years of responses, so a fast-growing county may have more older residents today than shown here. The survey uses a current-residence rule, so a seasonal resident may be counted in Florida or at another home depending on when they answered.
Use this data
You are welcome to cite these tables. Please credit the U.S. Census Bureau as the source and link to this page for the county summary.
Florida population FAQ
What percentage of Florida is 65 or older?
About 21.1% of Florida residents are 65 or older, according to the Census Bureau's American Community Survey 2019–2023 5-year estimates. The national figure is 16.8%. Only Maine has a higher share.
Which Florida county has the oldest population?
Sumter County, home to most of The Villages, where 57.8% of residents are 65 or older. Charlotte, Sarasota and Citrus counties follow.
Which Florida county has the most residents 65 and older?
Miami-Dade County, with about 452,114 residents aged 65 and older, followed by Palm Beach and Broward counties.
How many Floridians are 85 or older?
About 564,476 Floridians are 85 or older, based on the Census Bureau's American Community Survey 2019–2023 5-year estimates.
Where can older Floridians find local help?
Call the Florida Elder Helpline at 1-800-963-5337. It connects you to the Area Agency on Aging and Aging and Disability Resource Center that serves your county.
Data sources
- U.S. Census Bureau, American Community Survey 2019–2023 5-year estimates, table B01001 (Sex by Age): data.census.gov
- U.S. Census Bureau, table B18101 (Sex by Age by Disability Status): data.census.gov
- U.S. Census Bureau, table B01002 (Median Age by Sex): data.census.gov
- CDC MMWR, "Nonfatal Bathroom Injuries Among Persons Aged ≥15 Years, United States, 2008": cdc.gov
- Florida Department of Elder Affairs, Elder Helpline: elderaffairs.org
Planning a safer bathroom in Florida? Talk with us.
Free quotes for Florida homes. No pressure.
1-888-779-2284 (BATH)